With the gross deficiency of testing in Canada, it strikes me that no numbers have any reliability except for number of deaths associated with COVID-19. Even that is going to be increasingly suspicious as we do not report number of collateral deaths - people who needed critical care for other reasons such as stroke, coronary or other organ distress, but for whom there were no critical care beds available.
So, anyway, here is my chart of the mortality rate in Canada reflecting number of days to double. Data obtained from CTV News: Tracking every case of COVID-19 in Canada. The present average over the last 3 days suggests it is taking us about 4 days to double the number of fatalities from COVID-19.
Google Analystics
Saturday, 28 March 2020
Saturday, 21 March 2020
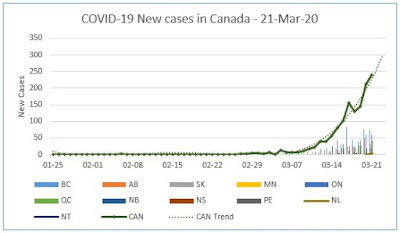
COVID-19 Canada New Cases 21 Mar 2020
Two charts today
The first uses the same format as yesterday, but as at today according to data from CTV News:
The second starts from Feb 22 and limits provincial bar charts to the top 4: BC, Alberta, Ontario and Quebec. All provinces are still reflected in the Canada total numbers.
I strongly recommend that you read this article by TED speaker Tomas Pueyo.
It is a longish read in which he cogently makes the case for copying China, Korea and Singapore by testing and isolating COVID-19 patients BEFORE they show symptoms and start infecting numbers of other people beore they even know they are sick:
The first uses the same format as yesterday, but as at today according to data from CTV News:
Tracking every case of COVID-19 in Canada
To be clear, the charts reflect new cases for each day, not the cumulative total of all cases.The second starts from Feb 22 and limits provincial bar charts to the top 4: BC, Alberta, Ontario and Quebec. All provinces are still reflected in the Canada total numbers.
I strongly recommend that you read this article by TED speaker Tomas Pueyo.
It is a longish read in which he cogently makes the case for copying China, Korea and Singapore by testing and isolating COVID-19 patients BEFORE they show symptoms and start infecting numbers of other people beore they even know they are sick:
Coronavirus: The Hammer and the Dance
Friday, 20 March 2020
COVID-19 New Cases in Canada as of 20-Mar-2020
This is not good
The curve is becoming more perpendicular, not flattening
Data derived from CTV News:
The curve is becoming more perpendicular, not flattening
Data derived from CTV News:
Tracking every case of COVID-19 in Canada
Tuesday, 17 March 2020
COVID-19 New Cases in Canada March 17/20
This chart is based on figures published today at 10:30 pm by CTV News: Tracking every case of COVID-19 in Canada
https://www.ctvnews.ca/health/coronavirus/tracking-every-case-of-covid-19-in-canada-1.4852102
It is following a predictable curve given how the disease has progressed in other countries.
Subscribe to:
Comments (Atom)


