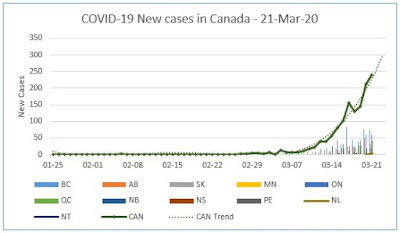
The first uses the same format as yesterday, but as at today according to data from CTV News:
Tracking every case of COVID-19 in Canada
To be clear, the charts reflect new cases for each day, not the cumulative total of all cases.The second starts from Feb 22 and limits provincial bar charts to the top 4: BC, Alberta, Ontario and Quebec. All provinces are still reflected in the Canada total numbers.
I strongly recommend that you read this article by TED speaker Tomas Pueyo.
It is a longish read in which he cogently makes the case for copying China, Korea and Singapore by testing and isolating COVID-19 patients BEFORE they show symptoms and start infecting numbers of other people beore they even know they are sick:


No comments:
Post a Comment